Single-cell Analysis Tools
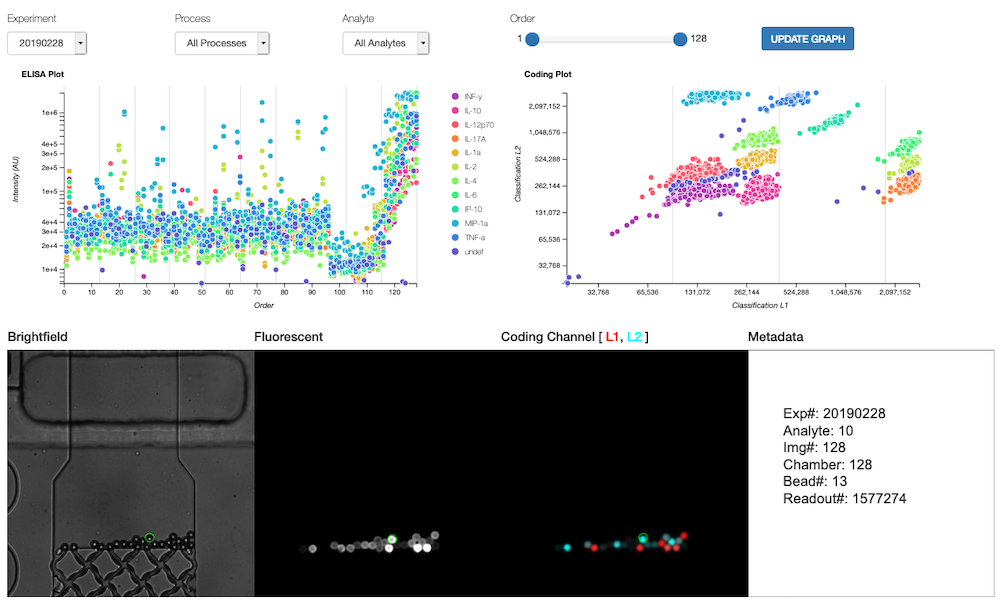
We developed single-cell analysis tools for interrogating data and performing statistical analysis on single-cell results. An interactive web interface was built using D3 (JavaScript) and JQuery for selecting and highlighting data between two plots (protein measurement and barcoding channels) as well as pull up associated images with metadata. This enabled quality control the datasets and also improve the assay.
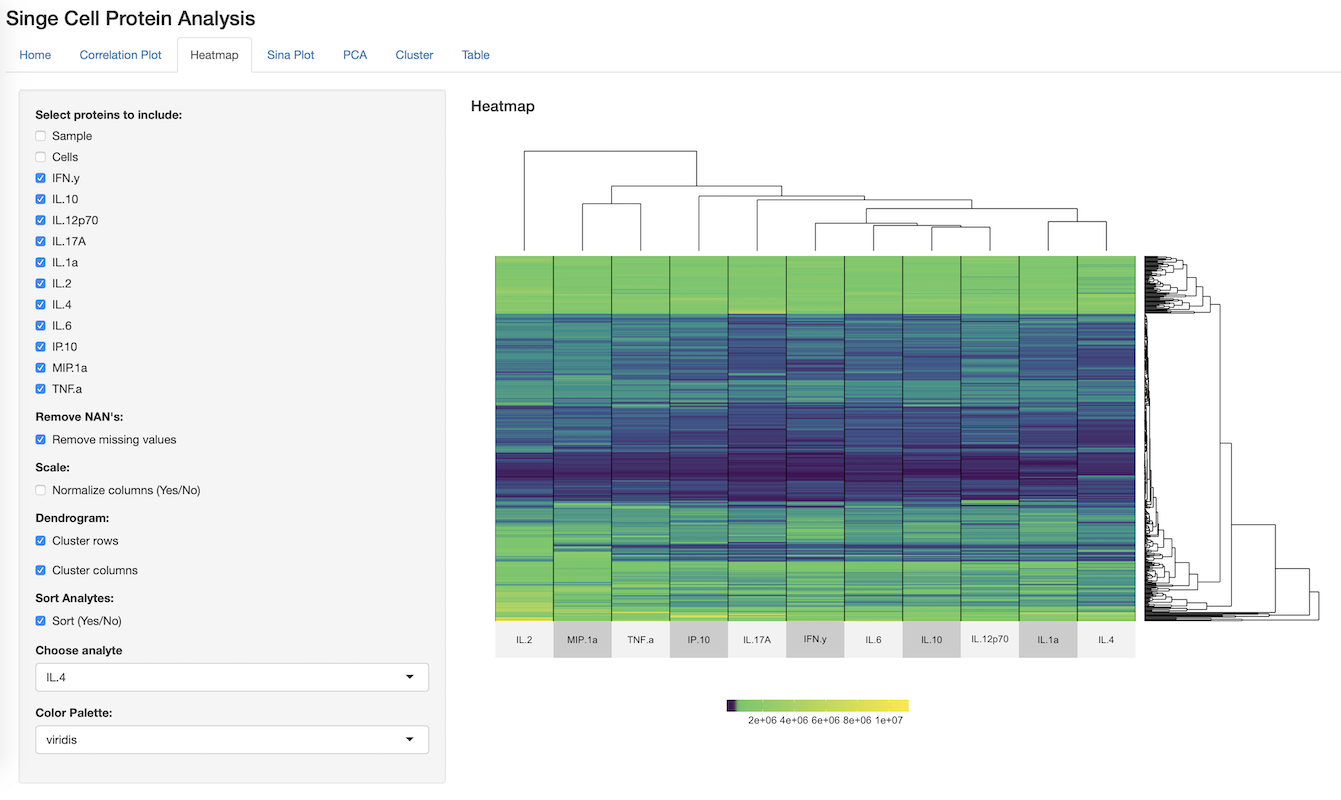
A Shiny app (R) was built for interpreting the results after performing quality control. The web application was able to display 1) correlation plots, 2) heatmaps, 3) sina plots, 4) principle component analysis (PCA), 5) k-means clustering and 6) display the data in a table. Other analysis tools are in the process of being added (t-SNE, SPADE, etc). This tool enables users to easily produce single-cell analysis statistics and clusting as well as interactively explore their data.
The software interfaces and code will be share after publication.